Anyone here using Zabbix for monitoring? If so how can one stack
graphs? For example I want to see all the graphs associated with a
device, instead of see a particular graph (Traffic on port 1, or CPU
usage, or Disc 1 Usage, etc) for all devices.
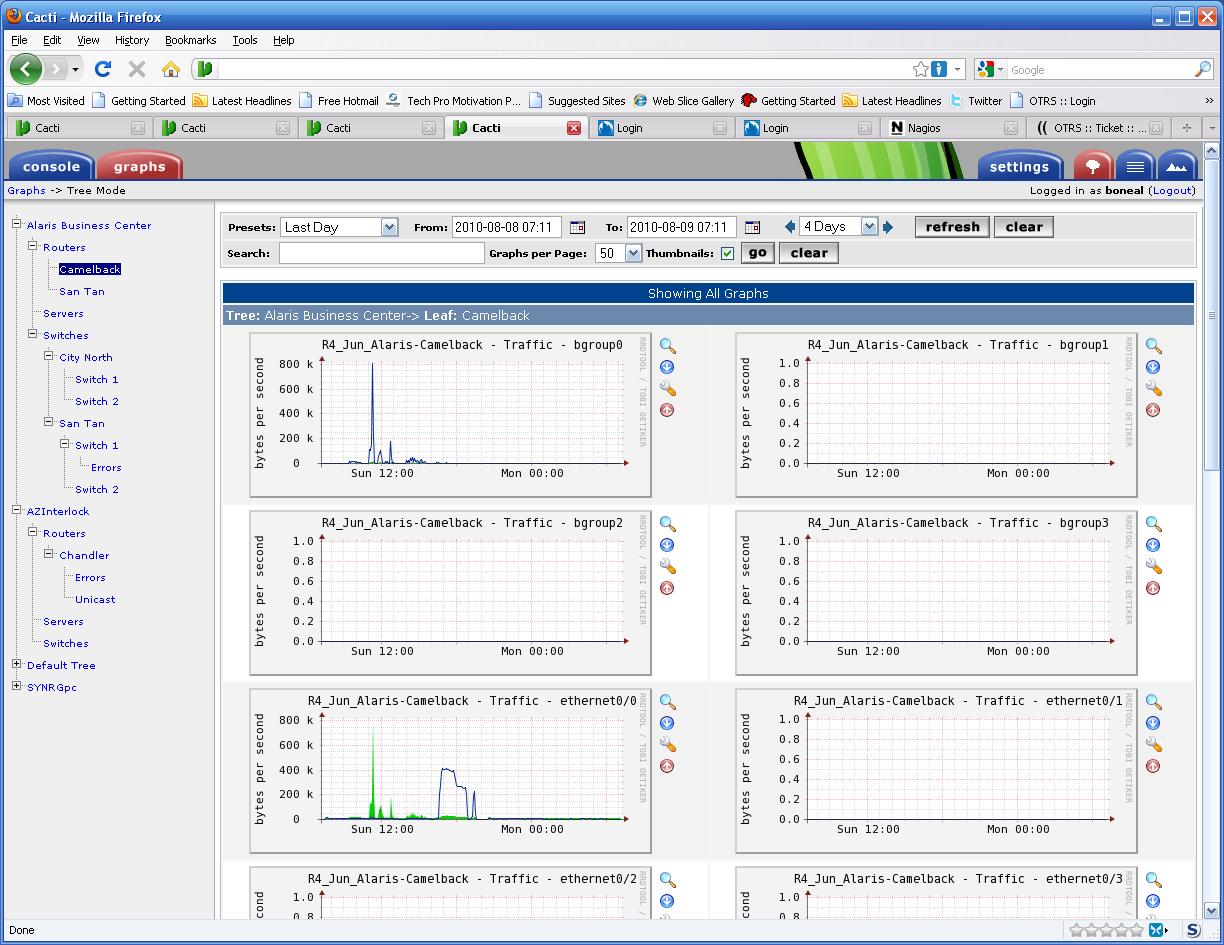
If you have used Cacti then what I am basically looking to do is
duplicate the device thumbnail overview in Zabbix (See attached)

---------------------------------------------------
PLUG-discuss mailing list -
PLUG-discuss@lists.plug.phoenix.az.us
To subscribe, unsubscribe, or to change your mail settings:
http://lists.PLUG.phoenix.az.us/mailman/listinfo/plug-discuss


